SQL Profiler
SQL Server Profiler
is a tracing tool provided by Microsoft since SQL Server 2000 version. It is used to trace activities and operations executed on a specific SQL Server database engine or Analysis Service to be analyzed later.
SQL Server is responsible for two main operations:
- Tracing: It can monitor all operations executed over an instance
- Replay: It can rerun all operations logged in a trace later
How to use Profiler?
When you open the Profiler, the authentication form is shown. You have to select whether you need to connect to an Analysis Service instance or a Database Engine. Then you should enter the instance name, the authentication type, and the credentials:
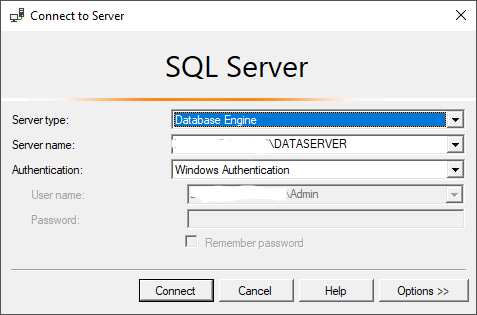
Figure 3 – Profiler authentication form
When the connection is established, a new trace form is shown. In this form, there are two tabs: (1) General tab and (2) Events Selection.
In this first tab, you have to enter the trace name. Then you can select whether you need to save the trace results into a table or external file and also if you need to pause the trace at a specific date-time.
Also, you can select a trace template from a drop-down list based on your needs. Note that a template is a set of tuning events that are caught by the profiler trace. There are different predefine templates such as T-SQL, Tuning or you can select the standard (default) template or start from scratch by selecting the Blank template:
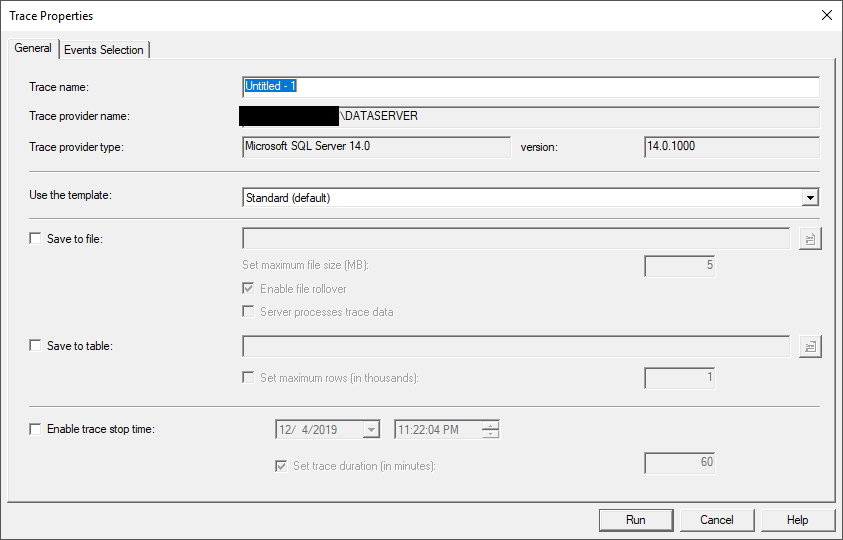
Figure 4 – General tab of the Trace Properties form
In the Events Selection tab, you can select all events that you need to include in the trace, not that you can add some filters. As an example, if you need only to trace the operations executed in a specific database, then you can add a filter on the database name property. Note that even if you select a template in the General tab, you can edit the event’s selection:
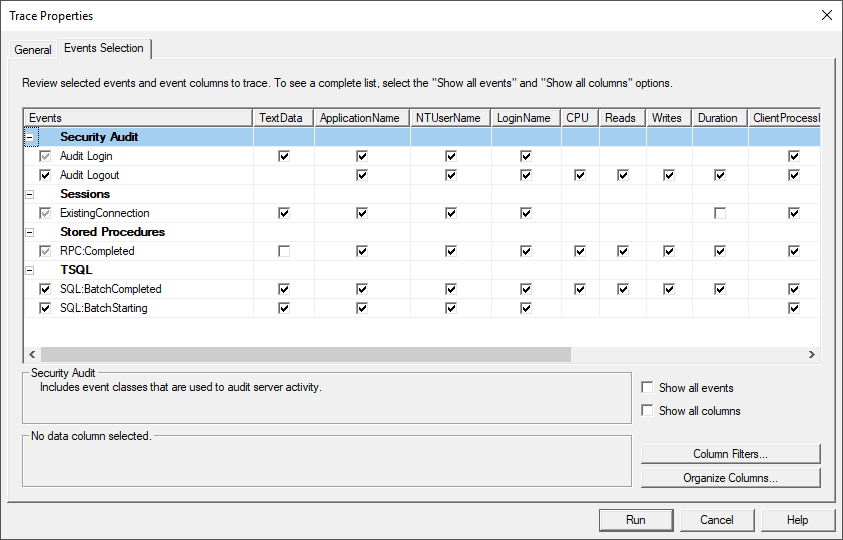
Figure 5 – Events selection tab of the Trace Properties from
For more details about creating and running a trace over a specific database, you can refer to a previously published article, where I used SQL Server Profiler to catch the SQL command executed by an SQL Server Integration Services package: SSIS OLE DB Source: SQL Command vs Table or View.
SQL Server Profiler can be used to detect what are the commands executed by an application over a database for security and tuning purposes. To read more about this tool, you can refer to the official documentation

Comments
Post a Comment